
We solve: Measuring the accessibility of tourism destinations with the aid of isochrone maps
In the Satakunta region, small and medium-sized tourism destinations are dispersed in many places. Many of them are located outside the residential centers which may make them difficult to access. With the rising popularity of biking as a mean of transportation, destinations might have difficult time gauging their own accessibility. Analyzing the situation with intelligent, data-based tools and methods might prove useful – one such method being automatic generation of isochrone maps.
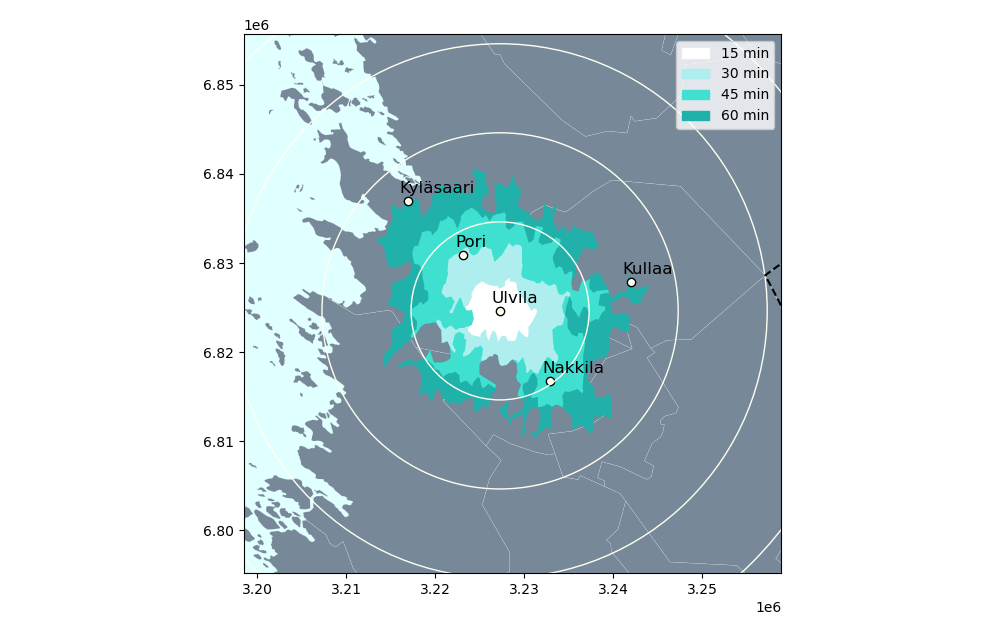
What is an isochrone map? An Isochrone map illustrates the length of a journey with borders drawn on a map to indicate the minimum travel time. The area covered by the borders is often colored to better illustrate their coverage. At its simplest, such a map could be made, for example, by coloring the entire area that one could reach by car from the city of Pori in an hour. A simple yet powerful concept to portray the duration of travel – especially when it can be generated anywhere on the map.
Let’s begin by developing a modular, digital tool to generate isochrone maps. To start, we need the following tools:
- Python programming language to develop the tool. Python and its community can provide us with the required libraries and sources for a quick development cycle.
- OpenStreetMap’s overpass-turbo REST API for generating a base map and its locations.
- OpenRouteService’s Isochrone API for generating the isochrone layouts.
- Pandas, GeoPandas, Matplotlib, Numpy and Shapely libraries to help us in building the necessary parts for the maps.
In addition, we need a list of all the residential centers in Finland. This list can be acquired from Wikipedia.
Once the tools and interfaces have been clarified, we can start working on the tool itself. The tool would work as follows:
- The user enters the coordinates, the travel method (walking, cycling, car or public transport) and the amount of time to measure in minutes.
- The tool checks the validity of the parameters entered, and then makes a request to the OpenRouteService isochrone API service according to the parameters set by the user.
- In response, the interface should return the "plotting instructions" for the isochrone map. The instructions are in a JSON file format, so the tool can use the Pandas library to convert them to a Pandas table. The conversion makes it easier to read and process the data.
- The instructions allow the tool to plot the isochrone area using the Matplotlib library on a map of Finland, using base maps from OpenStreetMap and names of the residential centers collected from Wikipedia.
- As a result, the tool outputs a finished map where the user should clearly see all the residential centers covered by the isochrone layer.
Voilà! We have now created a modular, reusable tool using public application programming interfaces that allows sites across Satakunta to map their own accessibility. As a further development idea, the map could be placed on a website, for example, to be used by as many users as possible, and the possibility of using the user's own location could be embedded.
These and other solutions for business intelligence development in tourism are being researched in the Center for Tourism Business Development. Together with the Business Intelligence Center the business intelligence capabilities of the whole region are developed towards a data-based future.
Did you know?
- Many public APIs are not fully accessible and need a so-called "API-key". The key may be tied to a fee or otherwise restrict the use of the interface. Keys are often used to prevent misuse of interfaces.
- OpenStreetMap is a volunteer-run map service. Many online and in-app maps use its interface as the basis for their own services.
- Coordinates do not work the same on every map! There are over 6000 different coordinate systems in the world. Many geographical areas use the coordinate system that best suits them. One coordinate system that describes the geographical boundaries of Finland is so called "EPSG:2393" or "Finland Uniform Coordinate System".